The Stratigraphic View
Each stratigraphic level can contain one or more zones defined by their top and base geological event. Only events of type 'horizon', 'unconformity' and 'intrusion' can be used to define zone boundaries in a stratigraphic model.
You can also choose to build your structural model based on a specific hierarchical level. For example, you can build surfaces for the 3D structural model based on the highest hierarchical level (Level 1) only. You can add zones from another (deeper) hierarchical level to the structural model in a second iteration to create, for instance, infill horizons from markers.
Principle behind 'levels' in the Stratigraphic View
For each event that you assign to the stratigraphic model, a surface will be constructed once you create your 3D structural model. The sequential order of construction of these surfaces, together with the 'internal' construction settings (conformable/proportional to surface above/below) is key to the final layout of the internal zonation of the structural model because each surface is constructed relative to a surface that was previously constructed. Within the set of rules that determine the order of surface construction
- The data representation (tri-mesh, 2D grid, polyline set, point set or marker) of the event that you assign to the stratigraphic model.
- The stratigraphic level at which the event is placed in the stratigraphic model.
Of both factors, the underlying data representation is dominant, with surfaces based on ‘dense’ data representations (i.e. tri-meshes, 2D grids, point sets and polyline sets) always being constructed before surfaces based on ‘sparse’ data representations (i.e. markers). In the application, this is called geometric prioritization, which follows the logic that dense data, typically derived from seismic interpretations, is of higher quality and more continuous than ‘sparse’ data derived from well log interpretations (i.e. markers). Surfaces based on ‘dense’ data are therefore constructed first and constrain the surfaces based on ‘sparse’ data. Within the group of events with ‘dense’ data, first stratigraphic Level 1 surfaces will be constructed, then Level 2, etc. Only when all ‘dense’ data surfaces are constructed, ‘sparse’ data surfaces come into play, following the same hierarchical logic. The combination of geometric prioritization and stratigraphic order, induced by the position of the events in the stratigraphic model, ensures that the internal zonation of the 3D geological model is geologically realistic.
Accessing the Stratigraphic View
The Stratigraphic View is commonly opened as part of the Stratigraphic Modeling workflow in the Stratigraphy strip. In this case, opening the Edit Model form also opens the Stratigraphic View, and the two may be used together when defining the hierarchy. An initial hierarchy is displayed depending on your selection on the Generate Zones form of the workflow.
If a marker set, seismic interpretation or surface set has been assigned, this initial hierarchy is displayed when the view opens. Otherwise, if the Manual option was selected in the Generate Zones form, a blank Stratigraphic View is opened and you can use any of the means described later in this section to manually develop the hierarchy.
To review the stratigraphic model, you can also access the context menu of the stratigraphic model in the JewelExplorer with a right-click and select the option Open In Workflow.
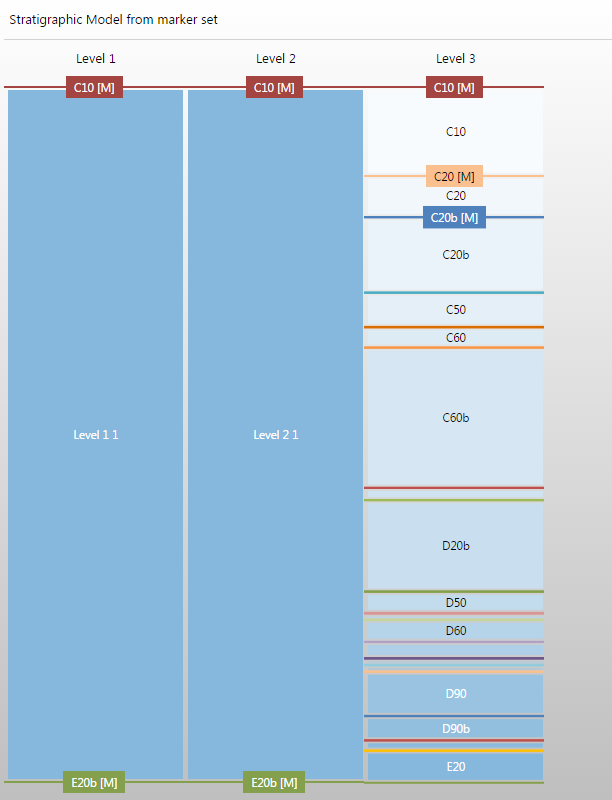
Stratigraphic model, zones derived from events represented by a marker set: markers are by default placed at Stratigraphic Level 3 click to enlarge
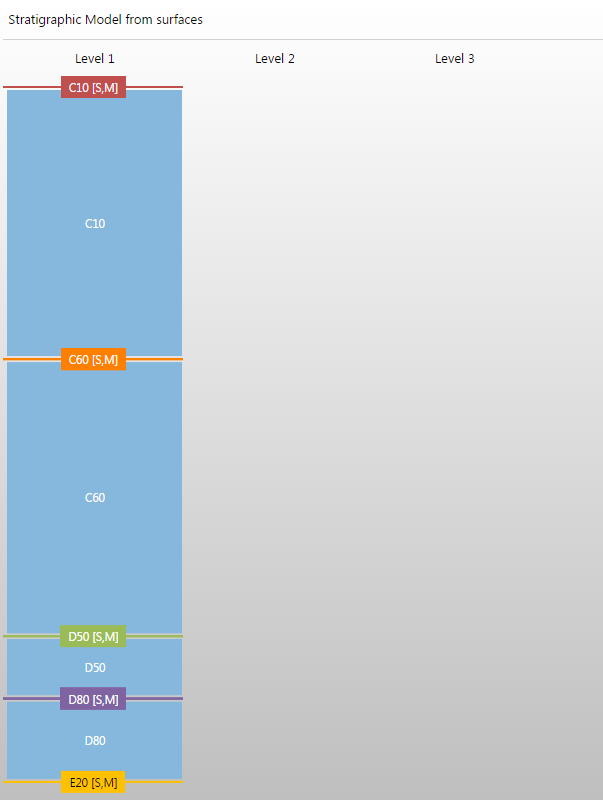
Stratigraphic model, zones derived from events in a seismic interpretation click to enlarge
You can open an empty Stratigraphic View by selecting Stratigraphic View from the Views drop-down box in the Workspace section of the Strip.
Creating the stratigraphic hierarchy from existing data
You can leverage existing events in surface sets, marker sets or seismic interpretations to create the initial hierarchy of zones by using the Generate Zones form. The generation of zones uses the relative depth of the event's representations to create the initial zonation order. The zones are created based on the level specified on the form.
For example, if the level of zone generation for a marker set is Level 3, then only one zone will appear on both Level 1 (the highest stratigraphic level) and Level 2. Any zones that are created from the marker set will be assigned to Level 3. As each zone created from a marker set will typically be bound by two well markers, the application will automatically assign a zone name according to the well marker that bounds the top of the zone. These names can be changed by double clicking the zone in the Stratigraphic View or in the Edit Model form by double clicking into the Name column for the zone of interest.
Note that zone names need to be unique per stratigraphic level. With the hierarchy initially generated from a surface set, marker set or seismic interpretation, you can edit the stratigraphic model to correctly define the zone hierarchy. This can be done by inserting, removing, merging, splitting, promoting or demoting the zones as described below. Additionally, more stratigraphic levels can be added (maximum up to Level 9).
The amount of detail depends on the purpose of the model, the complexity of the geology in the model area and the available data. It is important to note that the zones are named after the names used in the marker set, surface set or seismic interpretation.
In the case that the Manual option was selected in the Generate Zones form your stratigraphic model will consist of one zone at Level 1. This will allow you to completely define the hierarchy by hand through the context menus for the zones and levels.
Defining the hierarchy
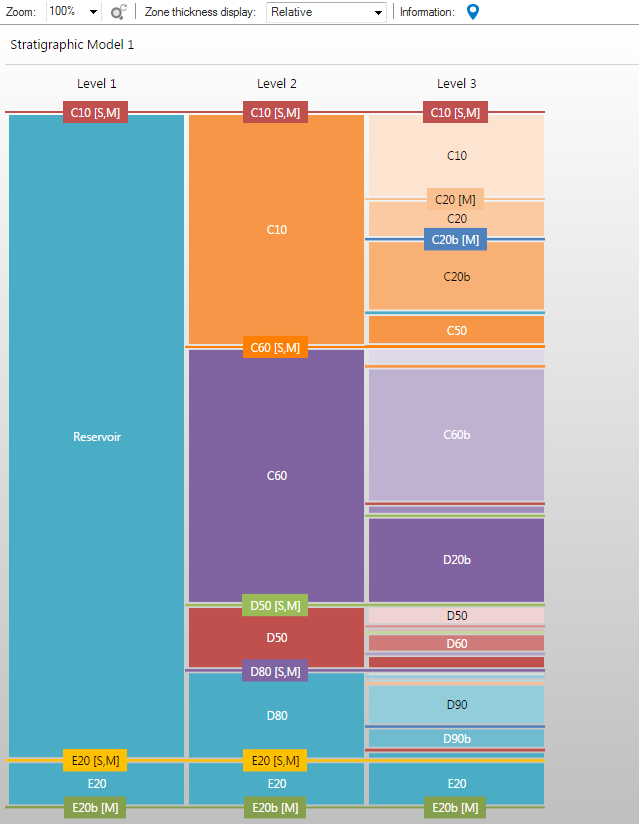
At level 1, define zones for the highest level of the stratigraphy. You can add more detail to the stratigraphic model at a deeper level. The zone boundaries indicated with M or S have either a marker [M] or a point set, polyline set, 2D grid or tri-mesh [S] representation in the solution. click to enlarge
Zone boundaries in the Stratigraphic Model are orange, but when you have assigned events to them, you can verify whether underlying data is available for those zone boundaries. To do this, select (check) the relevant Seismic Interpretation, Surface Set and/or Marker Set in the JewelExplorer; zone boundaries for which underlying data is present take the color of the events and an [S] or [M] is printed behind the zone boundary name.
Orange event names indicate that no event is present in the solution, or that no marker set, surface set or seismic interpretation is checked in the JewelExplorer. click to enlarge
As previously noted, all interaction with the hierarchy in the Stratigraphic view is accomplished through the right-click context menu available for each zone and level. Each of the options available in the context menus is described in the table below, the following is a description of the common actions performed via the context menus.
- Managing levels - Levels can be added, deleted and renamed by right-clicking on the 'Level N' text at the top of the hierarchy in the Stratigraphic View. For example, right-click on 'Level 1' if you only have a single level defined.
- Adding zones - Right-click on a zone in the Stratigraphic View and from the context menu select, for example, Insert zone above, Insert zone below, or Split zone at a deeper level. While Insert zone above and Insert zone below will create new zones on the same level as the zone that was right-clicked, Split zone at a deeper level will create a zone on the next deepest level. Note that a zone name needs to be unique per stratigraphic level.
- Assigning geological events - You can assign geological events to the zone's boundaries. These geological events should contain at least one of the following data representations: tri-mesh, 2D grid, polyline set, point set or well markers. From the context menu for a zone, you can select Set top event or Set base event to assign the geological event for each zone boundary. The list contains all events that have not been assigned yet to a zone boundary. From the same context menu, you can also select Insert event from marker to choose an event from a list of available markers.
- Promoting and demoting zones - The Promote zone option will move the selected zone upward in the hierarchy, while demoting a zone with the Demote zone option will move it deeper.
- Splitting and merging zones - Zones without any children can be split. Splitting a zone creates the specified number of zones on the same level as the zone that the context menu was opened from. Zones can be merged as long as they all belong to the same parent zone. To merge zones you will need to Shift+click or Ctrl+click the zones of interest prior to opening the context menu.
Stratigraphic View context menu
Select a zone in the Stratigraphic View and right-click to apply one of the following options via the context menu:
Name The name of the selected zone.
![]() Rename zone Opens the Rename Zone dialog in which you can type a new name for the zone.
Rename zone Opens the Rename Zone dialog in which you can type a new name for the zone.
![]() Set top event Choose an existing event (it can be represented by a 2D grid, tri-mesh, point set, polyline set or marker) that you want to use as primary input for modeling the top of the zone.
Set top event Choose an existing event (it can be represented by a 2D grid, tri-mesh, point set, polyline set or marker) that you want to use as primary input for modeling the top of the zone.
![]() Set base event Choose an existing event (it can be represented by a 2D grid, tri-mesh, point set, polyline set or marker) that you want to use as primary input for modeling the base of the zone.
Set base event Choose an existing event (it can be represented by a 2D grid, tri-mesh, point set, polyline set or marker) that you want to use as primary input for modeling the base of the zone.
![]() Insert event from marker You can only use this option when you have selected to generate zones manually on the Generate Zones form. All the markers that are available for selection are listed. From the list, select a marker to be inserted.
Insert event from marker You can only use this option when you have selected to generate zones manually on the Generate Zones form. All the markers that are available for selection are listed. From the list, select a marker to be inserted.
 Insert child zone above Creates a child zone at the top of a deeper level. The zone name needs to be unique per stratigraphic level.
 Insert child zone below Create a child zone in the base of a deeper level. The zone name needs to be unique per stratigraphic level.
 Insert zone above Creates a zone directly above the selected zone, in the same level. The zone name needs to be unique per stratigraphic level.
 Insert zone below Creates a zone directly below the selected zone, in the same level. The zone name needs to be unique per stratigraphic level.
![]() Split zone Splits the selected zone into a specified number of zones at the same level.
Split zone Splits the selected zone into a specified number of zones at the same level.
![]() Split zone on deeper level Splits the selected zone into a specified number zones on a deeper level.
Split zone on deeper level Splits the selected zone into a specified number zones on a deeper level.
 Demote zone Adds a copy of the selected zone to a deeper level, and also moves its children to a deeper level.
![]() Promote zone Moves the selected zone up to the parent level by splitting the parent zone.
Promote zone Moves the selected zone up to the parent level by splitting the parent zone.
![]() Promote top event Splits the parent zone into two zones and couples the top surface between these zones.
Promote top event Splits the parent zone into two zones and couples the top surface between these zones.
![]() Promote base event Splits the parent zone into two zones and couples the base surface between these zones.
Promote base event Splits the parent zone into two zones and couples the base surface between these zones.
![]() Merge zones The selected zones will be merged into a single zone.
Merge zones The selected zones will be merged into a single zone.
![]() Set color Select a color for the zone. The child zones of the selected zone will have the same color but in a lighter shade.
Set color Select a color for the zone. The child zones of the selected zone will have the same color but in a lighter shade.
 Autocreate colors Select a predefined colorset from the context menu which will be applied to the child zones.
 Delete zone Deletes the selected zone (and its child zones) from the Stratigraphic view.
The features in the toolbar at the top of the Stratigraphic View allow you to change the vertical zoom level of the view, change the zone thickness display size and view basic info for each zone in the hierarchy.
Zoom You can vertically zoom the view in two ways: by pressing Alt and scrolling to the desired zoom level, or by using the Zoom text box to select a level. With the zoom box you can type in a zoom value or select from the drop-down list. If you select a zone in the view and use Alt + scroll to zoom, the selected zone will stay focused in the view.
![]() Reset zoom Clear all zoom changes, resetting the zoom level back to 100%.
Reset zoom Clear all zoom changes, resetting the zoom level back to 100%.
Zone thickness display Set the display of the zones on the lowest hierarchical level to relative (default setting) or equal. In equal thickness mode all zones are equally thick on the lowest hierarchical level present in the view. See the section below for more details on this setting.
Probe (shortcut key: Ctrl+I) Activates the Probe. When you hover over a zone the Zone name and top and bottom events are displayed.
Additional info on zone thickness display
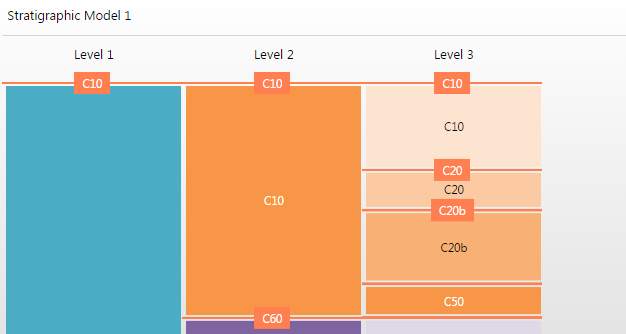
By default, the zone thickness display is set to Relative, where the average zone thicknesses are taken from the input horizons or markers. This thickness is also reflected in the Thickness column of the Edit Model form. When the zone thickness display is set to Equal, all zones on the lowest hierarchical level are displayed with an equal thickness. This is particularly useful if you want to quickly get an overview of all available zones, especially when there is a large thickness variation between the zones (e.g. large overburden). The image below demonstrates the difference between the Relative and Equal zone thickness display settings.
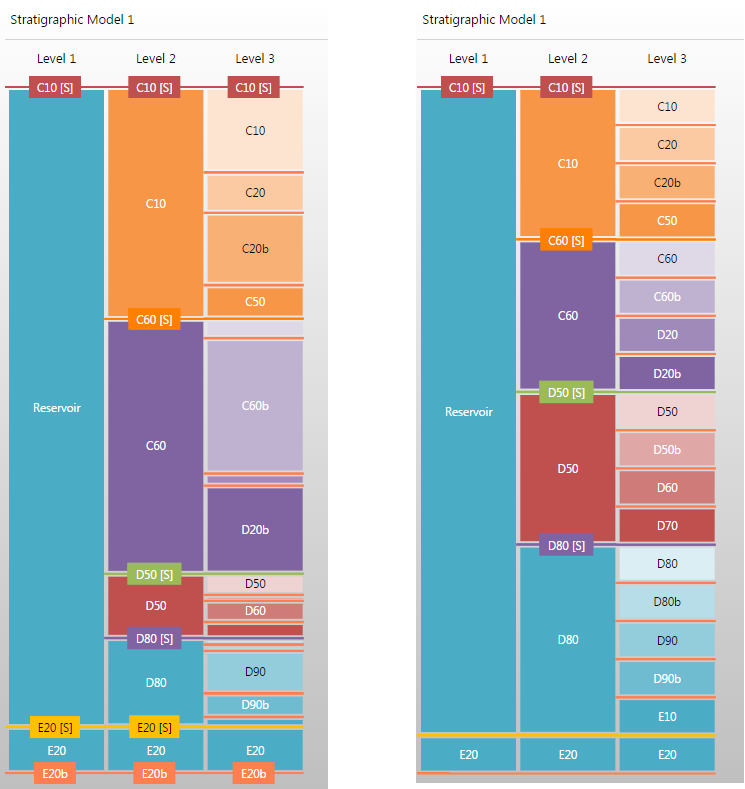
The stratigraphic model, Stratigraphic Model 1, displayed using Relative zone thickness (left) and Equal zone thickness (Right). click to enlarge
Docking the Stratigraphic View
Like most of the views in the application, the Stratigraphic View, 3D Structure Zonation and 3D Grid Zonation View can be docked at any location in the view.
The zones will scale accordingly, and this way you always have an overview of the created stratigraphy at hand.
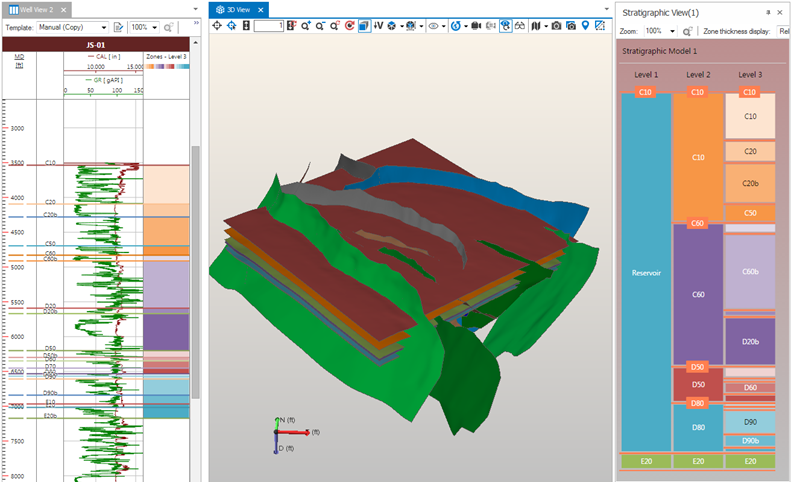
The Stratigraphic View docked side-by-side with the 3D View and Well View. click to enlarge